Airports:USA® Forecast:
6%+ Enplanement Growth – But With Geographic Access Shifts
According to a new forecast, the US air transportation system is in for some serious growth in the next 18 months.
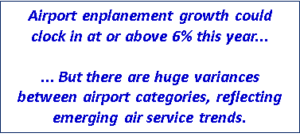
Accelerating Growth. Currently, enplanements at US airports are already tracking up over 5.4%, but based on expected trends in the airline industry, growth may show strong acceleration as the year closes out, clocking in for the full year possibly at over 6.0%.
Within airport categories, the strongest percentage growth will be at Midsize Non-Hubsite airports – those currently between 1 million and 2.5 million enplanements, where traffic is now skyrocketing at a 9.2% rate over last year.
It’s a different story, however, at the low end, where Small Non-Hubsite airports of under 500,000 enplanements are seeing less that 2.2% growth.
Airport Classifications That Reflect The Real World. Let’s start with a quick overview of new airport classifications.
 The incredibly obsolete classifications still used by the FAA – where airports are all described in some way as being various size “hubs” – are now a detriment to real airport planning and confuse the public. The FAA uses the term “hub” in a context that has no relationship whatsoever to what’s going on in the air transportation industry.
Alternatively, Airports:USA classifies airports in four categories, each of which are affected by different airline and consumer dynamics:
Hubsite Airports. Here’s a flash to the FAA, which is still wallowing in nomenclature and a 50-year old concept of the airline industry: no airport is a “hub.”
The reality is that an airline (or in a few cases, like ORD, ATL and SEA, where it’s more than one airline) creates a hub operation at a given airport. Within Airports:USA, these are classified as airports where an airline has made the corporate strategy decision to concentrate aircraft resources with the objective of interconnecting passengers between flights, and their connecting enplanements make up 25% or more of the airport’s traffic.
Large Non-Hubsite Airports. These are airports experiencing over 2.5 million enplanements and where no airline is operating a true connecting hub operation.
Medium Non-Hubsite Airports. These are airports with between 1 million and 2.5 million annual enplanements, and where no airline has a connecting hub operation.
Small Non-Hubsite Airports. These might be also termed “regional” airports, but that term can also be misleading. These are airports with under 1 million annual enplanements.
 In the analysis below, we’ve also carved out of the last category of airports – Small Non-Hubsites – just those that have under 500,000 enplanements, to demonstrate the major shifts in air traffic flows and air access trends.
Now, to the data….
Yes, It Is The Economy. The facts can no longer be politically-ignored. Surges in airline traffic over the past 12 months are not a fluke. Consumers are spending more discretionary and business money on air travel. Tax cuts, higher business confidence, and lower unemployment do have bearing on air traffic demand.
Fundamentally, the US air transportation system has likely never been as robust. Even with much higher fuel prices, the expected acceleration of RJ retirements has slowed. Carriers need the lift.
More To Come… Overall, regardless of increases in fuel costs, air traffic demand shows no indication of falling off. As it stands today, US carriers are planning almost another 5% increase in seat production in the 4th quarter, compared to same period last year. This is not “excess capacity” as some of the “analysts” on Wall Street may claim – it’s simply taking advantage of increased revenue opportunities.
It’s Network Carriers Driving The Growth. While there continues to be a lot of high-profile expansion on the part of ULCCs, the vast majority of the capacity growth in the 4th quarter – 70.8% of it, to be precise – will be at the four main network carriers – American, Delta, United, and Southwest.
This shows that the traffic expansion in 2018 is fundamental – i.e., due to core consumer demand, and less so due to ULCCs, where the (successful) operating model is largely to stimulate new passengers based on low fares.
Four Categories – And A Look At Smaller Airport Trends. A review of the growth trends at the four major airport categories in the Airports:USA forecast reflects strong national growth, but an evolving geographic realignment of air service access.
Let’s look at the category forecasts. Beyond the four sets of airports, we’re culling out the changes at airports with <500,000 enplanements. It reveals a core emerging trend in the US air transportation system.
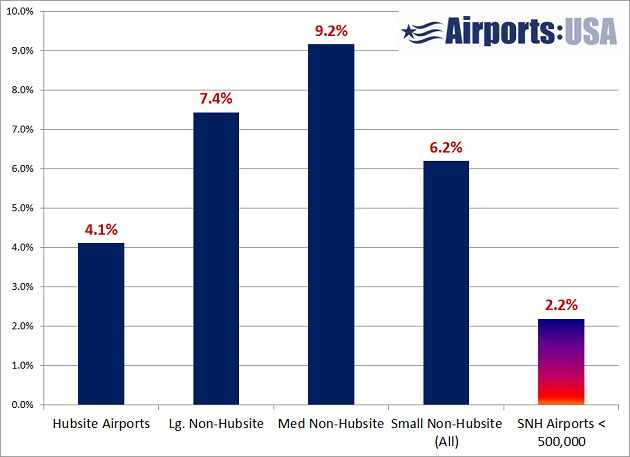
Continued Regionalization of Air Access. Note that the growth is strongest – percentage-wise – is in the Mid-Non-Hubsite category – 9.2%.
But for smaller community airports, the story is a bid different. At airports with under 500,000 enplanements, the growth is less than half the national average – just 2.2%.
Smaller regional airports – those under 1 million enplanements – today account for only 2.6% of America’s traffic. That’s way down from almost 4.0% in 2000. There’s a message here.
Consumer air travel patterns are changing, and, along with shifts in airliner fleets and operating economics, some smaller communities will increasingly find their air access shifting to an airport other than the local one.
The New Imperative: Re-Thinking Regional Connectivity. This air service dynamic – the decreasing ability of some smaller communities to support connective scheduled air service at the local airport – is one that demands new regional commercial planning.
Due to rock-solid economic and consumer realities, the air service connectivity at the local airport at some communities is going or gone, and it’s not coming back.
Nevertheless, the imperative for every community is to stay connected with the global economy – and often that will mean in the future via an airport other than the local one.
At some small communities, trying to keep or recruit local service that consumers will actually use is about as effective as forming a bucket brigade on the Titanic.
Traffic Growing. But Geographic Air Access Is Shrinking. It’s a trend that regions of the nation must now contend with – the continued reduction in economically-viable connective scheduled air service at very small airports, particularly those within reach of a much larger air gateway.
Fact: consumers won’t shoehorn their travel plans to fly locally, when an hour or even 90 minutes away, there are far more convenient and often less total time-consuming options than using the low frequency flights that the local airport can only support, even in cases where there’s an EAS subsidy involved. It’s already happening at places like Topeka, Youngstown, Laughlin-Bullhead City and others.
They all will continue to have air service access – but by and large, it won’t be at the local airport, anymore.
 Hundreds of thousands of dollars, maybe millions – both locally and some from government agencies – are poured yearly into doomed schemes to keep or find scheduled flights at airports that have no earthly chance of supporting them, and where local consumers often have better alternative options.
Two years ago, the US DOT had a well-meaning industry task force formed to find “solutions” to getting air service back to small airports, somehow with the misguided assumption that unless there was service at the local airport, the community would be cut off from the world. Results – nothing. Reality has marched on.
The chart says it all… while Small Non-Hubsite airports (those under 1 Million enplanements) will see a 6.2% growth, when we cull out only those airports experiencing under 500,000 enplanements, the conclusion is clear: air transportation economics, new communication channels, and consumer trends are combining to make small community air service much more vulnerable.
This is another reason that the US needs to revise its priorities in regard to regional access to the global economy, because these factors are making air service at the local airport a lot less future-viable.
Plateau In 2020. This growth can be expected to slow in 2020, simply based on known airline fleet trends. However, there are no dynamics now in play that would indicate a decline in overall US enplanements.
Summary Report Now Available. A copy of the summary report can be obtained by clicking here and requesting it. It contains additional data in regard to fastest growth airports in each category as well as other insights.
Forecast & Planning. As indicated by the data outlined, Boyd Group International focuses on future trends – i.e., forecasts that identify changes that airports, communities, and aviation-related companies need to address.
When you need real forecast and trend expertise, give us a call.
We don’t run with the pack. We’re well ahead of it. And so are our clients.
 Results were the only priority, even if it meant tossing whole kingdoms – and their subjects – into the dustbin of history. If his staff failed to deliver, they were history, too.
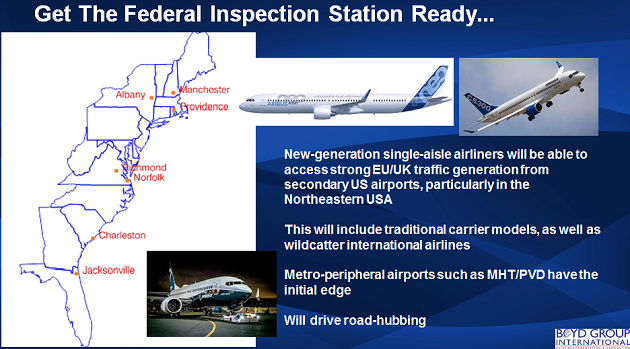
 While its local population is comparatively small, that’s eclipsed by the global commercial make up of the Charleston region. It’s one of the largest and most efficient container-ship ports in the nation, and the growing presence of global-centric, high-tech industries such as Mercedes-Benz and Boeing, identified it in our forecasts as a key future feed point for European carriers.
 The above slide, along with the other insight presented at the IAFS