Second Quarter 2018 O&D Data
Indications: A Strong 2018 & 2019 Ahead
Subscribers to Aviation DataMiner™ now have access to the full range of reports and analytical tools for the 2nd quarter of 2018. Differing from other sources, we assist our subscribers in understanding what the numbers mean – and what they don’t mean.
First: Some of the overall data:
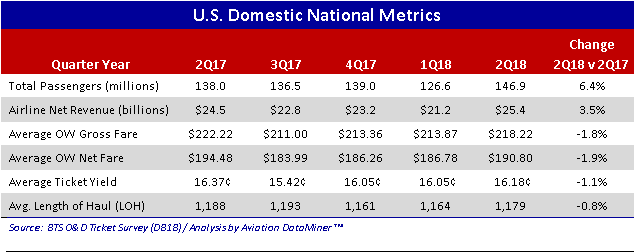
Stimulated Passenger Growth: It’s obvious that the robust economy, including the billions of dollars put back into consumers’ wallets due to the recent tax cuts, is translating into more spending on air travel. Almost nine million more people took air trips in the quarter compared to same quarter 2017.
Ticket Fares Slightly Down, But… Consumers on average paid base air fares almost 2% less than last year. What is not reflected are effects of ancillary fees – which, aside from going up in the past six months, can shift during the year due to consumer spend patterns. Conclusion: the cost of air travel is probably not really “down” – the ticket fare is just the down payment for many consumers. But in any case, it certainly has not increased markedly.
Prepare For The Media Shows. Typically, the usual suspects in the media – as well as some veneer analysts – will pull down this raw data and inevitably start to pontificate about the air travel as if they just got an official e-mail from St Peter’s route planning department.
Proving that having no understanding of source data is no barrier to writing news stories, there will be a parade of dimbulb headlines, like, “Newark (or wherever) has among the highest fares in the nation!” or “East Nobody-Goes-There Municipal Airport Consumers are paying XXX% more than the national average.”
‘Course, these types of profound analyses mean diddly. There is no set of consistent and comparable metrics that relate to computing an “average fare” that has any value as a comparison between airports.
Message to the media: The cost of air travel isn’t like that of a gallon of gas. The air service product itself at each airport is unique to that facility. Factors such as average trip length, size of the market, type of air service that the market can afford to support, and a whole passel of other factors make these media comparisons sheer amateur nonsense.
Key Trend Metrics. However, there are some data that can be mined to get a view of what’s changing… examples:
Denver in the quarter was the #3 domestic US-carrier O&D traffic airport… again, based on traffic carried by US airlines.
Atlanta? – it’s #5, and DFW – it’s #10.
Note the term “domestic” – international traffic carried by US carriers at these airports is in addition to the above. So is traffic carried by foreign carriers.
And here’s where the read-it-and-report-it media types – not to mention some “analysts”- fall off the trolley. It’s NOT airport data… it’s airline data, specifically, US airline data reported and sorted by airport.
So, O&D carried by foreign carriers is not specifically reported, although the obsolete and fuzzy BTS reporting system sometimes gets some of this traffic mixed in by error.
So, for the media and consultant crowd that purport that raw BTS/DOT data to be complete and comprehensive, they’re howling at the statistical moon.
There is a lot more data that needs to be put into the mix. Airports like ATL, JFK, SFO, LAX, ORD have substantial foreign carrier enplanement levels that change the mix and metrics entirely.
If You’re Not Using Aviation DataMiner™ – You’re Not Using The Right Analytical Tool. This is a reason that our subscribers have a better grasp of the trends in air transportation. Aviation DataMiner™ delivers the firepower to analyze all aspects of the air transportation industry. And, uniquely, that includes Airports:USA® the only enplanement forecasts accomplished in the private sector.
BGI will be issuing the Quarterly Traffic Trend & Short-Term Forecast to our subscribers shortly… better data, better insights.
If you’re interested in predictive analytics that go beyond just numbers, click here to request a free trial to Aviation DataMiner™. Give it a try – and, unlike other sources, we’re always ready to assist our subscribers in development of custom reports.
Better analytics mean better futurist planning. We look forward to hearing from you!
_____________