Monday Update – October 29, 2018

Airports:USA® Forecast:

6%+ Enplanement Growth – But With Geographic Access Shifts

According to a new forecast, the US air transportation system is in for some serious growth in the next 18 months.

Accelerating Growth. Currently, enplanements at US airports are already tracking up over 5.4%, but based on expected trends in the airline industry, growth may show strong acceleration as the year closes out, clocking in for the full year possibly at over 6.0%.

Within airport categories, the strongest percentage  growth will be at Midsize Non-Hubsite airports – those currently between 1 million and 2.5 million enplanements, where traffic is now skyrocketing at a 9.2% rate over last year.

It’s a different story, however, at the low end, where Small Non-Hubsite airports of under 500,000 enplanements are seeing less that 2.2% growth.

Airport Classifications That Reflect The Real World. Let’s start with a quick overview of new airport classifications.

The incredibly obsolete classifications still used by the FAA – where airports are all described in some way as being various size “hubs” – are now a detriment to real airport planning and confuse the public. The FAA uses the term “hub” in a context that has no relationship whatsoever to what’s going on in the air transportation industry.

Alternatively, Airports:USA classifies airports in four categories, each of which are affected by different airline and consumer dynamics:

Hubsite Airports. Here’s a flash to the FAA, which is still wallowing in nomenclature and a 50-year old concept of the airline industry: no airport is a “hub.”

The reality is that an airline (or in a few cases, like ORD, ATL and SEA, where it’s more than one airline) creates a hub operation at a given airport. Within Airports:USA, these are classified as airports where an airline has made the corporate strategy decision to concentrate aircraft resources with the objective of interconnecting passengers between flights, and their connecting enplanements make up 25% or more of the airport’s traffic.

Large Non-Hubsite Airports. These are airports experiencing over 2.5 million enplanements and where no airline is operating a true connecting hub operation.

Medium Non-Hubsite Airports. These are airports with between 1 million and 2.5 million annual enplanements, and where no airline has a connecting hub operation.

Small Non-Hubsite  Airports. These might be also termed “regional” airports, but that term can also be misleading. These are airports with under 1 million annual enplanements.

In the analysis below, we’ve also carved out of the last category of airports – Small Non-Hubsites – just those that have under 500,000 enplanements, to demonstrate the major shifts in air traffic flows and air access trends.

Now, to the data….

Yes, It Is The Economy. The facts can no longer be politically-ignored. Surges in airline traffic over the past 12 months are not a fluke. Consumers are spending more discretionary and business money on air travel. Tax cuts, higher business confidence, and lower unemployment do have bearing on air traffic demand.

Fundamentally, the US air transportation system has likely never been as robust. Even with much higher fuel prices, the expected acceleration of RJ retirements has slowed. Carriers need the lift.

More To Come… Overall, regardless of increases in fuel costs, air traffic demand shows no indication of falling off. As it stands today, US carriers are planning almost another 5% increase in seat production in the 4th quarter, compared to same period last year. This is not “excess capacity” as some of the “analysts” on Wall Street may claim – it’s simply taking advantage of increased revenue opportunities.

It’s Network Carriers Driving The Growth. While there continues to be a lot of high-profile expansion on the part of ULCCs, the vast majority of the capacity growth in the 4th quarter – 70.8% of it, to be precise – will be at the four main network carriers – American, Delta, United, and Southwest.

This shows that the traffic expansion in 2018 is fundamental – i.e., due to core consumer demand, and less so due to ULCCs, where the (successful) operating model is largely to stimulate new passengers based on low fares.

Four Categories – And A Look At Smaller Airport Trends. A review of the growth trends at the four major airport categories in the Airports:USA forecast reflects strong national growth, but an evolving geographic realignment of air service access.

Let’s look at the category forecasts. Beyond the four sets of airports, we’re culling out the changes at airports with <500,000 enplanements. It reveals a core emerging trend in the US air transportation system.

Continued Regionalization of Air Access. Note that the growth is strongest – percentage-wise – is in the Mid-Non-Hubsite category – 9.2%.

But for smaller community airports, the story is a bid different. At airports with under 500,000 enplanements, the growth is less than half the national average – just 2.2%.

Smaller regional airports – those under 1 million enplanements – today account for only 2.6% of America’s traffic. That’s way down from almost 4.0% in 2000. There’s a message here.

Consumer air travel patterns are changing, and, along with shifts in airliner fleets and operating economics, some smaller communities will increasingly find their air access shifting to an airport other than the local one.

The New Imperative: Re-Thinking Regional Connectivity. This air service dynamic – the decreasing ability of some smaller communities to support connective scheduled air service at the local airport – is one that demands new regional commercial planning.

Due to rock-solid economic and consumer realities, the air service connectivity at the local airport at some communities is going or gone, and it’s not coming back.

Nevertheless, the imperative for every community is to stay connected with the global economy – and often that will mean in the future via an airport other than the local one.

At  some small communities, trying to keep or recruit local service that consumers will actually use is about as effective as forming a bucket brigade on the Titanic.

Traffic Growing. But Geographic Air Access Is Shrinking. It’s a trend that regions of the nation must now contend with – the continued reduction in economically-viable connective scheduled air service at very small airports, particularly those within reach of a much larger air gateway.

Fact: consumers won’t shoehorn their travel plans to fly locally, when an hour or even 90 minutes away, there are far more convenient and often less total time-consuming options than using the low frequency flights that the local airport can only support, even in cases where there’s an EAS subsidy involved. It’s already happening at places like Topeka, Youngstown, Laughlin-Bullhead City and others.

They all will continue to have air service access – but by and large, it won’t be at the local airport, anymore.

Hundreds of thousands of dollars, maybe millions – both locally and some from government agencies – are poured yearly into doomed schemes to keep or find scheduled flights at airports that have no earthly chance of supporting them, and where local consumers often have better alternative options.

Two years ago, the US DOT had a well-meaning industry task force formed to find “solutions” to getting air service back to small airports, somehow with the misguided assumption that unless there was service at the local airport, the community would be cut off from the world. Results – nothing. Reality has marched on.

The chart says it all… while Small Non-Hubsite airports (those under 1 Million enplanements) will see a 6.2% growth, when we cull out only those airports experiencing under 500,000 enplanements, the conclusion is clear: air transportation economics, new communication channels, and consumer trends are combining to make small community air service much more vulnerable.

This is another reason that the US needs to revise its priorities in regard to regional access to the global economy, because these factors are making air service at the local airport a lot less future-viable.

Plateau In 2020. This growth can be expected to slow in 2020, simply based on known airline fleet trends. However, there are no dynamics now in play that would indicate a decline in overall US enplanements.

Summary Report Now Available. A copy of the summary report can be obtained by clicking here and requesting it. It contains additional data in regard to fastest growth airports in each category as well as other insights.

Forecast & Planning. As indicated by the data outlined, Boyd Group International focuses on future trends – i.e., forecasts that identify changes that airports, communities, and aviation-related companies need to address.

When you need real forecast and trend expertise, give us a call.

We don’t run with the pack.  We’re well ahead of it. And so are our clients.


Monday Update – October 22, 2018

Starting Out This Week…

Wait ‘Till Madison Avenue Gets Hold of This Account…

Coming from almost nothing, he expanded his market share by subjugating populations of entire countries. If the competition didn’t agree, he simply whacked them out of existence.

He was a master at building brand-identity… he gained great fame for imposing it from eastern Europe all the way to Korea.

He brooked no nonsense from his subordinates – or his competition, both of whom often ended up in some form of untimely, albeit usually innovative, demise or another.

He had outstanding inter-personal skills in dealing with differences of opinion. Heck, he and his generals once dined on a giant platform, designed specifically to settle slowly during the repast to squash into the next world several Russian princes who didn’t agree with him.

The man was a regular love machine.

Results were the only priority, even if it meant tossing whole kingdoms – and their subjects – into the dustbin of history. If his staff failed to deliver, they were history, too.

So, with all this, he’s a natural guy to represent a modern airline.

That’s right, that famous paragon of warm customer service, Genghis Khan, will have his own airline next year, based in the China Autonomous Region of Inner Mongolia.

The advertising program should be a real hoot… “We plunder low fares…” or, “Our service terrifies the competition … and our customers, too…”

Or, the inflight announcements… “Put your seats and tray tables in the full and upright position…disobey, and you’ll be most regretful…”

They have 25 ARJ-21s on order.

And, as a regional touch, they’ll probably allow Mongolian war ponies as emotional support animals in the cabins, too.

___________________________

Main Focus This Week…

Charleston – London: The New Paradigm

Airports:USA Trend Forecasts Validated

Air Access Planning Has New Metrics

It’s not a sprawling metropolis. It has a population of less than one million.

It is not at the confluence of several Interstate highways. It has virtually no smokestack industries.

And shortly, British Airways will begin nonstop flights from there to London.

It’s Charleston, South Carolina, and the decision to start service across the Pond flies in the face of traditional airline route planning. Which is exactly the point. There are new air transportation dynamics in play – “tradition” is out.

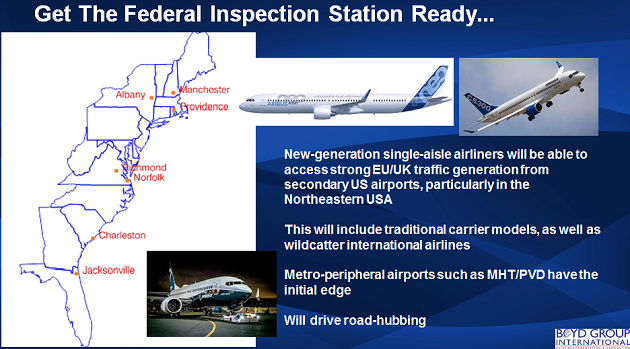
Global Economic Presence Now A Key Planning Metric. At the 23rd International Aviation Forecast Summit, August 19-21 in Denver, one of the forecast trend predictions was major UK/EU network carriers will be adding service to secondary non-hubsite airports on the Northeast and along the US East Coast.

We specifically and independently identified CHS as a prime target.

Boyd Group International’s Airports:USA forecast system is unique in that it goes way beyond historical data. It understands that global economic presence will now be a major determinant of where international network carriers decide to invest their aircraft resources.

Charleston – London, which is outside of any “traditional” market planning paradigms, is just one of the secondary cities the forecast identified.

Presented and discussed August 20th at the International Aviation Forecast Summit

Note: For clarity, BGI was not involved in the BA-CHS decision, nor with CHS. But the fact is that our forecast expertise independently identified the market opportunity, and it’s an example of the extensive research and global expertise we bring to our clients, from airports, to airlines, to financial institutions and more.

Identifying The New International Air Service Metrics. CHS is a poster child for the new future international air access metrics.

While its local population is comparatively small, that’s eclipsed by the global commercial make up of the Charleston region. It’s one of the largest and most efficient container-ship ports in the nation, and the growing presence of global-centric, high-tech industries such as Mercedes-Benz and Boeing, identified it in our forecasts as a key future feed point for European carriers.

Apparently British Airways came to the same conclusion.

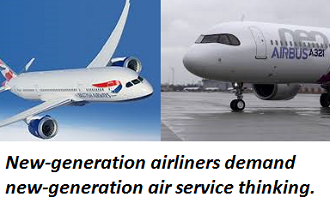
New Aircraft Capabilities Open New Trans-Atlantic Opportunities. Markets such as Charleston are near-textbook (the new textbook) targets for new-generation aircraft such as the A-321LR and the B-787.

Here’s a clue for folks still using past DOT data in futile attempts to forecast the future: new airliner capabilities will drive new airliner mission applications. Past traffic data are essentially just anecdotal – at best.

As the header on the slide suggests, the other six airports will be well advised to get their FIS ready with a facility plan and – importantly – a CBP staffing plan to quickly handle arrivals of 160 or more passengers from the Old World.

It’s Core Business Traffic. Fare-Stim Less of A Factor. This is not to be confused with route expansion by low-fare wildcatter carriers, such as WOW and Norwegian.

They are only after price-generated net-new traffic, while British, Lufthansa (and even the SkyTeam/Delta system) are interested in tapping the growing international business market for feed through their hubsites on the other side of the Atlantic. Now, with new-capability airliners like the A-321LR, the 787, and new iterations of the 737, airports like those in the slides above need to think about the future in a different context.

Interested In Moving Your Planning Into The Future… We’re Ready. To be sure, there are no guarantees, but the message is clear – again – that traditional “air service development” analyses that wallow out obsolete “PDEW” data – particularly international data from the BTS – are a great way to stay in the past.

BGI is the only consulting and forecast firm that isn’t afraid of questioning traditional data and traditional thinking. As the slide above shows, and our 30-plus year track record verifies, Boyd Group International isn’t reticent to question ambient thinking.

As examples of how our approach has assisted clients in exploring new international opportunities click on the link at the end of this Update.  Look it over, and then hit the Contact Us button above, and let’s start discussing your new air service access plan.

 SoonOn-Line Airport Traffic & Trend Forcasts.

The identification of secondary targets for trans-Atlantic exemplifies the forecast and predictive analysis capabilities of the team at Boyd Group International.

Not Just Numbers. Insight. We’re now completing and beta-testing the first on-line, predictive trend and enplanement forecasts, Airports:USA On-Line .

It’s a product that is more than just forecast numbers. It also delivers cutting-edge insight regarding the current and expected changes in airline strategies and tactical market planning that airports need factor into future planning.

The above slide, along with the other insight presented at the IAFS Airports:USA session, are demonstrative examples of what the new, on-line program delivers. Key forecast trends will be a central part of the on-line program.

When there are dynamics that will affect an airport’s traffic levels, Airports:USA will flag it, and take the subscriber to a Dynamics page which will discuss the situation. It’s like having a forecast consultant with a couple of key strokes.

Available as an add-on feature for Aviation DataMiner subscribers, or as a stand-alone, Airports:USA will feature forecasts based on on-going updates in air service trends.

The New Norm – Capacity Volatility. With the “catch & release” route programs of some ULCCs, as well as new hub-term warning. This means that reliance on traditional metrics and methodologies to determine future traffic levels is simply not viable.

Over 140 of the nation’s airports are included, which comprise over 95% of all passenger traffic.

For more information on the new program, just click here and we’ll get you on the information list ASAP, and discuss how Airports:USA is the next generation in air service access planning.

And to explore our expertise in assisting clients in global projects, click here.

__________________


Monday Update – October 15, 2018

Skyhooks, The Easter Bunny…

…and Media Airport Fare Comparisons

These have one thing in common: they have nothing to do with reality.

BTS Data Is Out For The 2nd Q of 2018. One of the downsides of having raw federal data published is that too often folks in the Fourth Estate, completely without adult supervision, get their paws on it and then publish articles that once again prove that lack of knowledge of the subject matter is not a barrier to filling several column inches with intellectual sludge.

Data In The Hands of Amateurs. One of the most egregious is the dimbulb “fare comparisons” between airports that inevitably come out within hours of the BTS filing. It’s sort of like the recent headline that trumpeted something to the effect that “American has hubs in the top four connected US airports.” When the babble descends to that level, the media source is beyond help.

This is not to imply that there aren’t some really savvy and professional folks in the media covering air travel. The majority of network correspondents we talk to have an incredible grasp of the industry.

But every quarter when the DOT/BTS stats come out, there is a blizzard of articles from the lightweight Peanut Gallery that are amazingly devoid of any understanding of the subject matter whatsoever.

Air Travel Is A Set of Cost Factors At Each Airport. Here’s the bottom line: air transportation is not a single commodity, like a Big Mac or a gallon of unleaded, that can be compared from one city to another.

It’s a system where costs are the result of a range of factors specific to the destination. Things like the travel mix, the geographic location of the city, the destinational distribution – even the levels of ancillary fares at some carriers, which affect what’s reported as “fare revenue.”

Another problem is that the raw BTS data is based on per-passenger ticket-spend… which means that the mix of one-ways, round trips, and multi-leg itineraries are all tossed in together. These are factors that will vary by geographic location and are not consistent. The travel mix at Newark is very different than that at Charlotte, or at Shreveport.

We’ve compiled a comparison of the top 100 domestic O&D airports in the second quarter of 2018. It ranks airports by cost per mike, average length of haul, raw fares paid.

The top ten by passenger O&D are shown here.

However, the complete 100 O&D is available in an Excel spreadsheet, by clicking here and just requesting a copy.

In the meantime, take a gander at the rankings in the four key categories… particularly the average length of passenger haul. It varies by location and the economic and consumer factors at each.

Again, these data are not for folks that don’t have strong understanding of the airline industry. What’s reported by carriers as “ticket revenue” today is more like a down-payment, before ancillary charges. And those make ULCC-dominated airports – like SFB and PGV – a pool of intellectual quicksand for reporters who don’t understand the industry.

Subscribers to Aviation DataMiner™ and the Airport Quarterly & Short Term Forecasts, have this data in several report formats.

In airport planning – whether it’s facility projections, air access development, or making logical decisions on airline strategies – better data mean better planning for the future.

For more information on Aviation DataMiner™ – including the new and exclusive Airports:USA® forecast suite – click here.

Update – October 8, 2018

Second Quarter 2018 O&D Data

Indications: A Strong 2018 & 2019 Ahead

Subscribers to Aviation DataMiner™ now have access to the full range of reports and analytical tools for the 2nd quarter of 2018. Differing from other sources, we assist our subscribers in understanding what the numbers mean – and what they don’t mean.

First: Some of the overall data:

Stimulated Passenger Growth: It’s obvious that the robust economy, including the billions of dollars put back into consumers’ wallets due to the recent tax cuts, is translating into more spending on air travel. Almost nine million more people took air trips in the quarter compared to same quarter 2017.

Ticket Fares Slightly Down, But… Consumers on average paid base air fares almost 2% less than last year. What is not reflected are effects of ancillary fees – which, aside from going up in the past six months, can shift during the year due to consumer spend patterns. Conclusion: the cost of air travel is probably not really “down” – the ticket fare is just the down payment for many consumers. But in any case, it certainly has not increased markedly.

Prepare For The Media Shows. Typically, the usual suspects in the media – as well as some veneer analysts – will pull down this raw data and inevitably start to pontificate about the air travel as if they just got an official e-mail from St Peter’s route planning department.

Proving that having no understanding of source data is no barrier to writing news stories, there will be a parade of dimbulb headlines, like, “Newark (or wherever) has among the highest fares in the nation!” or “East Nobody-Goes-There Municipal Airport Consumers are paying XXX% more than the national average.”

‘Course, these types of profound analyses mean diddly. There is no set of consistent and comparable metrics that relate to computing an “average fare” that has any value as a comparison between airports.

Message to the media: The cost of air travel isn’t like that of a gallon of gas. The air service product itself at each airport is unique to that facility. Factors such as average trip length, size of the market, type of air service that the market can afford to support, and a whole passel of other factors make these media comparisons sheer amateur nonsense.

Key Trend Metrics. However, there are some data that can be mined to get a view of what’s changing… examples:

Denver in the quarter was the #3 domestic US-carrier O&D traffic airport… again, based on traffic carried by US airlines.

Atlanta? – it’s #5, and DFW – it’s #10.

Note the term “domestic” – international traffic carried by US carriers at these airports is in addition to the above. So is traffic carried by foreign carriers.

And here’s where the read-it-and-report-it media types – not to mention some “analysts”- fall off the trolley. It’s NOT airport data… it’s airline data, specifically, US airline data reported and sorted by airport.

So, O&D carried by foreign carriers is not specifically reported, although the obsolete and fuzzy BTS reporting system sometimes gets some of this traffic mixed in by error.

So, for the media and consultant crowd that purport that raw BTS/DOT data to be complete and comprehensive, they’re howling at the statistical moon.

There is a lot more data that needs to be put into the mix. Airports like ATL, JFK, SFO, LAX, ORD have substantial foreign carrier enplanement levels that change the mix and metrics entirely.

If You’re Not Using Aviation DataMiner™ – You’re Not Using The Right Analytical Tool. This is a reason that our subscribers have a better grasp of the trends in air transportation. Aviation DataMiner™ delivers the firepower to analyze all aspects of the air transportation industry. And, uniquely, that includes Airports:USA® the only enplanement forecasts accomplished in the private sector.

BGI will be issuing the Quarterly Traffic Trend & Short-Term Forecast to our subscribers shortly… better data, better insights.

If you’re interested in predictive analytics that go beyond just numbers, click here to request a free trial to Aviation DataMiner™.  Give it a try – and, unlike other sources, we’re always ready to assist our subscribers in development of custom reports.

Better analytics mean better futurist planning. We look forward to hearing from you!

_____________

Update – October 1, 2018

To Start…

More Cuba Fallout

AA is dumping CLT-HAV. The 55% load factor was a great way of losing money.

Just the latest. Except for Havana, and even there with limited traffic, Cuba is a financial black hole.

Facts v Hyperbole & Fantasy. In 2009 and later in 2014-2015, when Obama reduced flight restrictions between the US and Cuba, BGI accomplished extensive analyses of the US-Cuba market.

We concluded that any route planner that suggested a domestic market with the dismal aspects of just about anyplace in Cuba would find it a career-limiting move.

But that ran counter to the rapture in just about all areas of the travel industry. Cuba!!! Huge, gigantic expectations of floods of traffic!

Travel industry gurus were touting the “pent up demand.” At least a couple of airlines licking their chops, thinking about all the new flow traffic over their hubs to places like Santiago, Santa Clara, and more! Socialist-leaning wackos decrying how it would degrade the near-perfection of the Castro Worker’s Paradise – (“Come to Cuba before it’s ruined by Capitalism!” – was an actual sales pitch.)

Boyd Group International was the only consulting firm that actually researched the subject.

We found that Cuba was far from ready for prime time, and most of the markets in Cuba had no chance of any viable US traffic. No infrastructure. No business base. A government that smothers freedom and free speech. Other than capturing the existing flows to Havana, our data found the market to be a dog.

And that’s exactly what’s happened.

Let’s Stop The Delusional Nonsense. Cuba Is A Dead Market. At Least For Now.The current convenient scapegoat is President Trump, who has tightened restrictions on travel. But that’s nonsense…. the market that was foreseen – hordes of visitors and huge business investment – was a complete pipe dream.

All Trump did was to tighten restrictions on a market that had no viability, anyway. The lack of hotels, poor transportation, lack of free speech, and Cuban incomes not enough to pay bag fees – even if they could freely travel – completely transcend any increased restrictions.

As a vacation destination, Cuba is a bow-wow compared to other venues. As a place for business investment, there is zero free market.

Until the corrupt socialist cleptocracy in Havana is dumped, Cuba will be at best an Havana side-show for US carriers.
___________________

Get Ready For The Show…

The Seat Size Festival Is About To Begin!

Now that the FAA funding bill will apparently include a mandate for the agency to determine standards for airline seat size, get ready for a flood of non-factual reporting from the usual media suspects.

Starting With Facts, Instead of Fake News, Would Be Nice. Still circulating is the inaccurate babble – at this point traced to a completely-bogus story a few years ago in USA Today, but maybe from other sources, too – that back in the mid 1980s, the narrowest seat in the US industry was 19 inches.

Some stories also accessorize this bit of concocted data with the statement that the average width in US economy cabins is now 16.5 inches.

Anyone with a modicum of knowledge of the industry knows that this is another reason to question a lot of the stuff that certain sectors of the fifth estate put out. Those stats are created out of some reporter’s imagination.

They are inaccurate, and in light of the all-too-obvious information any semi-literate high school dropout could easily find, they can only be ascribed to the reporter not being too concerned with finding the truth.

Average Seat Width Has Actually Increased. Here’s a little hint: the standard economy seating in Boeing narrow-body airliners has been 6-across since the first 707-100 entered service sixty years ago. It’s still 6-across. So, contrary to a lot of the sloppy reporting, narrowing it from the alleged 19 inches to where it is today (@17.5) wouldn’t do anything to increase seating capacity.

Some facts:

  • The narrowest seat in the US major brand fleets is 17 inches wide – that’s on CRJ and ERJ airliners.
  • The actual average width has actually grown in the past 30 years, with the increase in the number of A-320 series and E-170/190 airliners entering service, which have 18+ inch-wide seats in the economy cabin.
  • The entry of the A-220 (nee CSeries) will increase this further, with economy seats even wider, and the middle seats at 19-inches.

This is not to say that seat pitch hasn’t shrunk. Indeed, it has actually atrophied – and that’s where the consumer angst is coming from, and it is mostly understandable. But it’s also fed by media stories that eagerly tend to generally equate airliner cabins with flying versions of the Black Hole of Calcutta.

But, it is a valid issue. To a large degree, the potential of flossing your teeth on the reclined seat-back in front of you isn’t too far from reality.

It is tight in many cases. The issue is whether it’s a health or safety issue. And that is a valid issue for discussion and illumination.

Consumers Complain. But They Don’t Vote With Their Wallets, This Time. Airlines certainly could go back to what was once 34-inch or higher seat pitch. But market realities are that this wouldn’t do anything to get more ridership. First, the currently-configured airliners in the US airline system are functionally full – 82% or higher, which means that during times folks travel, there aren’t many empty seats.

So, cutting out two rows of seats to gain more pitch in the rest of the cabin would be not only a revenue-losing proposition for airlines, but wouldn’t move the needle one centimeter toward getting more brand-loyalty. It’s been tried in the past – anybody remember American’s “More Room In Coach” program in the 1990s?

Prediction: Media Performances First. So, the matter is now front and center. We can look forward to lots of cheap theater at congressional hearings – bank on it, because it’s a chance for two-bit politicians who wouldn’t know “seat pitch” from a curve ball at Yankee Stadium, to clamber up on their soap-boxes and pander as being great protectors of safety and health.

Watch for the oh-so-outraged “consumerist” clowns to come in like the grand opening of a Barnum & Bailey circus. Of course, the usual lightweight-don’t-bother-with-facts contingent of the media will be posting lots of misinformation on seat configurations. Do prepare for lots of picto-grams of airplane cabins.

But don’t expect too much rational discussion.

FAA Response: Thank You For Sharing. And at the end of the festivities, the FAA will take all of this “under consideration,” wait the perfunctory post-hearing mourning period, and then issue a lengthy decision, relating their findings mostly to the issue of emergency evacuation. And buried under all of this babbling, there will be a de facto standard of probably 30-inches or maybe 31-inches for seat pitch. That will settle the matter.

That decision will be issued in the next 18 months.

In the meantime, plan for lots of cheap, but entertaining theater.


Update – September 24, 2018

The Media Vox Deorum

”..A new survey of hub connectivity shows that American Airlines operates hubs at three of the top four most highly connected U.S. hubs…”

Nice they picked those “connected hubs” to operate a hub.

Yikes.

__________________

China’s Tough Tariffs On US Airliners – Boeing’s Lovin’ It

A bit of reality.

Just in the past week, no fewer than a dozen new Boeing 737-800s were delivered across a customer base of eight Chinese airlines.

In addition, Shanghai Airlines received its first 787.

According to the prognostications of some experts last year, this should not be.

When President Trump implemented tariffs on some Chinese products, the folks in Beijing responded “aggressively” by supposedly implementing a 25% tariff on American airliners.

Some of the usual suspects in the media declared it was game-set-match for China and effectively warned about the need for massive expansion of the unemployment offices in the Seattle area.

Airbus, according to some of the “experts,” was fixin’ to see a flood of orders, while Boeing would now be shut out of the China market.

Gee, it didn’t turn out that way.

It’s All In The Fine Print. See, when China announced the tariff program, it took real media aviation experts, like Dan Reed, about fifteen minutes (assuming he took time to have a cup of coffee first) to illuminate that the imposed duties were based on airplane weight. And, carefully, the Chinese government put the limit at just short of the 787-800.

To the veneer analysts, China’s actions looked like a tough move. But in reality nobody in China has ordered -700s in years. (Matter of fact, some of the ones that were in China are now back in the US, acquired by Southwest.)

So the whole thing – like a lot of these retaliatory moves – was, at risk of cultural mix-and-match metaphors, Kabuki Theater.

Most of The Fleet Is New. Most of The Airliner Demand Is For Internal Growth. We just completed our 2018 Airports:China™ forecast, which again illuminated the incredible need for more lift in China.

Between 2013 and 2018 – just five years – passenger traffic at Chinese airports increased by over 68%. In 2018, we’re looking at another 8.6% – 10.3% according to our projections.

As we pointed out, China needs airliners. Big time. And they have no intention of cutting the flow – from any source – some media reports notwithstanding.

Trying to understand the China market requires adult supervision.

Industry Update – September 17, 2018

International Aviation Forecast Summit Accepting 2019 Host Proposals

The Summit draws not only aviation leaders, but also global attention to the business intelligence it delivers.

Our 2018 host, Denver International Airport, has advised that the IAFS delivered $35.9 million in earned media coverage, which in turn showcased the Mile High City.

We’ve opened the process to select next year’s venue. Airports and communities interested in hosting the aviation industry’s #1 conference can get an RFP package by clicking here.

We want to once again thank Denver International Airport for making the 2018 event something very special.

Pictures are now posted… click here to view.

___________________

Connecting America To The Globe.

In Some Cases, Local Air Service Isn’t A Part of It.

We received some questions regarding the recent update that used the disappearance of pay phones as part of the same dynamics that are shifting air transportation in the US.

The point is this: the phones are gone, but the communication they once facilitated is still going on, but via different consumer channels.

 It’s the same with air access. Just because there’s no scheduled service at a given small community airport does not mean that the consumers are stuck trying to get into or out of town. As with the communication channel represented by the pay phone, they’ve switched to other modes.

Often the mode is at another airport that offers better options than the population around the local airport can support. Often, these are actually more time-efficient, too, even with a long drive. Shoehorning an itinerary into the two dying flights at the local airport, and making a connection, when the distant airport has nonstop flights, makes no sense and is flatly non-competitive.

In other cases, the use of air no longer is a viable communication option. We’ve used ALB-ISP and BUF-ALB, where once robust O&D has now effectively evaporated. The process and cost of air travel is now eclipsed by other communication modes.

Studies, Analyses & Voodoo. Ignoring this reality is costing some small communities a lot of money, chasing elixirs that will get lots of passengers back at the local airport that simply cannot compete.

It is unfortunate that most of the policy thrusts coming from Washington are focused on small community airport service, which is in many cases completely at odds with consumer trends and air service economic realities.

What is also unfortunate is that frequently small communities and their airports are often guided into in blissful and expensive ignorance of what their own consumers prefer.

How ‘bout the jive-time unscientific local surveys, asking dumb questions like “would you use the local airport?” the blind positive responses from which are then assumed to be Delphi-like indications that just rolling up a plane to the gate will magically attract passengers.

Then there are the leakage analyses, replete with all sorts of expensive-to-buy ticket-purchase data and MIDT information and other voodoo, which are then passed off as proof that the local airport has great service potential. Or the “true” market studies that generally assume data to represent air service potential that’s anything but “true.”

The Consumer Is The Metric, Not Civic Hubris. And while all these rituals are going on, the consumer has found and is using other channels of communication and travel, none of which will be changed by the recruitment of one or two flights at the local airport, or worse, the emerging nonsense of just flying one market that can be operated, like, with a Cessna Caravan.

But somehow, having scheduled flights – any form, any operator, any destination –seems to be something on some small local airports’ bucket list.

Regardless of where the flights go, or whether they are connective to the global transportation system, or just ULCC service to Florida – it’s all the same. Just get scheduled flights – any scheduled flights, and the community will be saved.

Money & Studies Won’t Change Consumer Realities. Meanwhile, the consumer has usually found other channels of communication and access to air transportation. Better and often more time-efficient than whatever the local airport may be able to attract or subsidize.

Recently, we saw a small, un-served airport, whose downtown is less than a 60 minute drive from over 600 daily nonstop flights, claim it will pony up nearly a quarter million dollars in consultant fees and incentives to get scheduled flights at the local airport.

Any scheduled flights will do – network carrier or ULCC – which are entirely different transportation systems – it doesn’t matter.

It won’t matter to the consumer, either, who will continue to access the globe elsewhere.

Global Connectivity Is Multi Modal. If small communities and rural America are to keep up with the rest of the global economy, that means we need to pursue new communication options and channels to make sure that they are connected.

And in many cases, it will take a whole new perspective on the value and use of the local small community airport. As we move into the future, it will be logistics and distribution that offer the real opportunities.

A scheduled Cessna 208 lumbering off the gate with three passengers bound for a zero-connect destination will indeed meet the needs of some small airports’ bucket lists.

But won’t do diddly to expand the region’s global presence. Scheduled flights are not the only option.

In some cases, they aren’t an option.

Update – September 10, 2018

At World Routes, Our Clients Have The Advantage With Chinese Airlines

This week, our airport clients are heading to Guangzhou. And in meeting with Chinese airlines, they’re way ahead of the competition, with marketing materials, China-US forecasts, and data presentations created in Chinese by the professionals at Boyd Group International.

But the China opportunity is one for the future, and after World Routes give us a call. We can assist airports of all roles and sizes develop effective outreach to capture more business and Chinese investment for their regions of the country.

BGI is the foremost expert in China-US air service forecasts and strategic trends. Click here to go to BoydGroupChina.com and see how we can give you the advantage in attracting this new key revenue sector.

________________________

The Wildcatter Wild Ride

As we pointed out at the 2018 International Aviation Forecast Summit, the ULCC genre of airline is a whole new use of airplanes as vehicles to deliver a discretionary spending option, rather than chasing air service shortfalls.

Getting that confused can lead to PR embarrassment when the carrier shifts focus and pulls down some or all service. It’s not a good idea – nor sound planning – to portray ULCC entry as the same thing as American or Delta of United adding flights.

The two transportation modes are fundamentally different. ULCC entry is a positive event… but it needs to be handled carefully and described accurately. Otherwise there can be some serious egg on the Mayor’s face for reading off crib sheets and taking great credit for this wonderful air service event, only to have it evaporate shortly later.

Also as we noted, these carriers are like their wildcatter counterparts in the oil industry – they drill for revenue, and if it’s not there sufficiently, they are gone. Quickly.

A lot of the euphoria of a couple months ago at some Frontier-chosen cities is fixin’ to deflate due to this key dynamic of the wildcatter model… as a couple of examples, between now and February schedules indicate the following:

Austin – seventeen markets served by Frontier will be gone

Raleigh-Durham – nine nonstop destinations off the A&D board

San Antonio – fourteen markets pulled.

No Harm. No Foul. The public needs to be disabused of the notion that such pull-downs are any indication of local air service weakness. The majority of these yanked markets were low-frequency “day of week” flights. The loss is not a major hit to any of these airports. In most cases, they were simply experimental.

And even if operated only for a very short time before being pulled, the airports involved benefitted from traffic and PFCs they wouldn’t have had anyway. They introduced airports to consumers that wouldn’t have been there in the absence of Frontier.

Don’t Pop The Bubbly Too Loudly. Again, this wildcatter model is entirely different from traditional airline planning. That needs to be recognized in how local PR is handled when the grand announcements are made of new service. It could be gone in a couple of months, so the PR needs to be handled carefully.

The temptation to posture the entry as the result of the community’s “years of effort to lure the airline to town” should be avoided. That gets icky when the service is dropped after two months.

More excitement to come…

Update – September 4, 2018

September 10 2018 Update Is In Progress… Standby

_____

The Pay Phones Are Gone.

Rural Airports Need To Recognize The Opportunity.

The indications all are pretty consistent.

  • Last week, OneJet, an operation geared to providing point-to-point flights in non-served secondary markets that once may have had tens of thousands of passengers, ended up sleeping with the fishes…
  • Then we have Surf Air, a menu-driven sort of membership affair, aimed at re-connecting smaller airports, finding itself all wrapped around the financial axle with one of its suppliers…
  • How about Seaport, another attempt at intra-regional air service, going 86.
  • Pen Air, an airline that tried intra-regional air service, will have its assets sold off in a bankruptcy auction this week, someplace in Alaska…
  • And pay phones have also largely disappeared at airports.

All of these events are completely related.

They represent some of the major changes in consumer communication channels. And, like all such changes, they are part of other emerging shifts that can represent new opportunities.

The pay phone thing is emblematic. New communication channels – cell phones, instant messaging, e-mail, etc. – have made these devices completely obsolete.

Passenger Economics Have Changed. New Communication & Logistics Channels Are Emerging. It’s much the same with intra-regional and rural air service. What was flying around 30 years ago represented a communication channel that is as functionally and economically as obsolete as the little booths where mild-mannered Clark Kent did a quick costume change from time to time.

The fact is that the economics of air transportation have changed, and separate from that, the communication channels used by the modern consumer economy have also changed. Result: a lot of intra-regional air service, and a lot of service that some airports once could support, are as dead as the demand for black-and-white television sets.

Two Words, Benjamin: Logistics & Distribution. As we pointed out at the 2018 International Aviation Forecast Summit, consumer communication patterns and demands have changed. Intra-regional air service between small and mid-size communities is now largely an obsolete and inferior means of business interaction.

It is unfortunate that the air service strategies being foisted on a lot of airports are the equivalent of doing a study to find out how to bring back Ma Bell and have her re-hang some new pay phones on the terminal wall.

The failure after failure of airlines attempting to fill this “need” might be an indication.

Alternative Communication Pattern = Alternative Opportunities. We’ve pointed it out in the past. A lot of small airport air service development schemes are little more than primitive cargo-cult activities, albeit more marketing-sophisticated.

Instead of more “task forces” or DOT study voodoo, the future for small airports remains within the very dynamics that have killed off the pay phone and intra-regional passenger service.

As we noted at the IAFS™ in Denver, the name of the future game is logistics – moving goods and services faster and more efficiently. While communication is now instant, logistics are still in the molasses-bound 1950s.

Today, air cargo is not much different from when in the late 1940s American implemented its fleet of DC-6A freighters. Planes are faster, but overall logistical channels aren’t much changed. Move it to the cargo facility, build the pallet, fill the ULD, put it on the plane, and reverse the process at the other end.

Things are fixin’ to change.

Take A Look At A Rural Map. We’d suggest that US airports – particularly rural airports – start to look beyond wallowing around trying to recruit Cessna 208 flights that nobody wants to get on, and start to re-think their role in the next leap in logistics.

Look! Up In The Sky! It’s A Bird! It’s A Plane! No, It’s UAS Technology! Think rapid, cost-efficient distribution. Then look at a map of rural Wyoming or Montana… Every small airport has potential to re-invent itself as a logistics distribution point. No, not traditional “air cargo” – that concept is up there with hula-hoops.

It’s rapid logistics – not with today’s systems, but in ten years, technology will change logistics to be a much faster communication channel and one that is in all areas of the country. That will mean a need for rural distribution centers. Think about it.

Point: the demise of the pay phone and the fact that intra-regional passenger service is now obsolete, are just one side of the new logistics future.

Planning For The Future… It Means Dropping The Past. Rather than go on, Boyd Group International in the coming weeks will be exploring this new dimension facing airports – and particularly those in rural areas of the nation.

Moving into the future, there’s a lot of life after pay phones and scheduled service.

_____________________________

August 27, 2018 Update

Next Update On September 4, Recognizing The US Labor Day Holiday…

______________________


The #1 Aviation Event Delivers Again!

Just a Glance At A Few of The Highlights

The 23rd Boyd Group International Aviation Forecast Summit wrapped up right on time at 5PM, Tuesday August 21.

It capped four days of exciting events, presentations and discussion sessions. As always, the IASF™ had no pre-titled “panels” – instead, we got the views and perceptions directly from the leaders in the aviation industry.

The National And Industry Media Were At The Summit In Force. We were particularly excited this year to have media from all areas attending the Summit – CNBC, Bloomberg, The Wall Street Journal, Air Transport World, Airline Weekly, Dallas Morning News, Las Vegas Review-Journal, Access Intelligence, Avionics Magazine, Reuters, Flight Global, Skift, Travel Weekly, Cranky Flier, Airport Business – and a few free-lancers, too.

Do a search – you’ll find that the content of the Summit has driven a lot of in-depth media stories.

Our First Aviation Leadership Award. We were excited to implement the first IAFS™ Aviation Leadership Award, given this year to Robert Fornaro, CEO of Spirit, for his long contributions to thought-leadership in the airline industry.

All The Way – Straight Talk. From The starting point of a lively issues discussion with A4A CEO Nick Callio (and, yes, the PFC issue was a hot Q&A subject item – no holds barred) down to the final session on Tuesday, which delivered the only solid research and forecasts of the China-US market.

China – Time For Facts And Hard Data. By the way, in that final Airports:China™ session, we outlined the top potential second-tier markets between China and the USA, and the US airports in line for such flights – with some surprising conclusions.

This session was preceded by an incisive reality session with Dr. Chi Zhi Hang, VP-North America of Air China, where the issues of open skies and JVs between US and Chinese airlines were outlined to be the first step before any “flights to China” can even be envisioned from secondary US airports.

Communication Is Now Instant. Logistics Are Lagging. One of the key forecast points illuminated in the Forecast Mapping Session, which opened the Summit, was that logistics will be the next huge disruptive force in the airport industry. While communication channels have gone in the last 200 years from traveling along with logistics – i.e. at the speed of a horse – to nearly instantaneous from sender to receiver, logistics are only marginally more advanced than 50 years ago.

This is where new channels of logistics will be coming into play in the next five years, including UAS (drone) technology that could completely change distribution systems. How this will affect airports across the nation remains to be seen, but it could signal an economic rebirth at rural facilities.

United – Our Platinum Sponsor. We were honored to have Scott Kirby, president of United Airlines (one of our Platinum Sponsors) at the Summit to talk about his carrier’s expansion plans, such as at Washington Dulles. In the free-form discussion format of the Summit, a lot of ground was covered – with no canned presentations.

Southwest – Platinum Sponsor & Hawaii Update. Andrew Watterson EVP and Chief Revenue Officer of Southwest delivered an in-depth review of the carrier’s careful and planned move into Hawaii, and in the Q&A discussed how new stations for Southwest in the US were going to be well down the timeline.

New Fleets – New Opportunities. One of the most incisive sessions was the Q&A with all of the major aircraft manufacturers, where the attendees queried these senior executives on the potential effects of new super-long-haul airliners, as well as the emergence of fleets that have entirely new mission capabilities.

Airport Enplanements – Strong Growth, But Redistributed. The Airports:USA® session forecasted a 25% growth in national enplanements through year 2017. This is equivalent to the passengers now using the top six US airports combined.

On the other hand, the session revealed that air travel is less attractive as a communication channel in short-haul “commuter” markets such as between the DFW Metroplex and the Austin-San Antonio-Houston triangle, where traffic has dropped by 50% since 2000.

In addition, the costs and consumer shifts in the past 20 years have shown that air is also no longer economically feasible between many small and mid-size intra-regional markets. Regardless of the number of “task forces” or “studies” – air transportation is less and less of a communication channel compared to 30 years ago.

Wildcatter Airlines – A Whole New Consumer Product. The Airports:USA® session also outlined how ULCCs are now using airliners to deliver a whole new consumer spend product. Like the wildcatters in the oil business, these carriers seek out pockets of discretionary revenues that can be drilled and captured by offering low-cost air transportation.

These wildcatters make market decisions that are often galaxies away from the methodologies used by traditional airlines in making market decisions. They are a wild card when forecasting traffic – they come, and if the market works, they stay. If not, they leave.

These are just the tip of the huge mountain of presentations and business intelligence delivered at the 2018 Boyd Group International Aviation Forecast Summit.

Presentations Available To Summit Attendees. Where the presenters allow, and where there were slide presentations, these will be made available to Summit attendees shortly, along with the BGI forecast sessions.

Thanks To All of Our Sponsors… And Denver International! We want to thank all of our sponsors, including Platinum Sponsors Southwest Airlines and United Airlines.

We are in awe of the support of our host, Denver International Airport, which pulled out all the stops to make this the biggest IAFS™ yet.

In addition to all of the other extensive support, including special gifts to all attendees that showcased the great city of Denver, the staff of DEN delivered hospitality that bespeaks the Mile High City. But in particular, the Monday night event at Coors Field was nothing short of incredible.

We want to thank Kim Day and her staff, whose planning, support an execution made this year’s Summit incredibly successful!

We want to thank all of our nearly 400 attendees – your presence and participation makes the Summit what it is.

Thanks To The BGI Team, Too! We also want to recognize our own staff. Marian Boyd – CEO, and her immediate team – Sonia Watts and Dan Cohn – are the #1 team in the industry. Their work is the reason that this is now an event that aviation leaders clear their calendars for every year.

This is the industry standard… the attention to detail, the quality of the content, the close relationships with industry leaders from across the world, and the Marine Corps-like focus on absolute perfection – are the reasons attendees tell us that the Summit is the best aviation event – better than any other.

Professionalism is the at the core of Boyd Group International, and the Summit is the proof. Thanks again to every one for making it happen.