Media “Air Fare Comparison” Stories
…Actually, Most Are Just Fake News…
There are lots of warning labels out there…
“Don’t try this at home…”
“Closed course – professional drivers only…”
“Dangerous if used by untrained individuals…”
“Read instructions first…”
And, now we need to add another one, in regard to BTS and DOT quarterly reports.
“Raw BTS data requires analysis by knowledgeable professionals only…”
In the past week, we’ve been inundated by amateur-act news stories, comparing “air fares” from airport to airport, mostly by media folks who have not a clue regarding what BTS data represents.
Sorry to pop some bubbles out there, but these stories are about as valid and accurate as comparing the price of mangoes in Anchorage with the cost of a set of wrenches at a Sears bankruptcy close-out in Omaha. The two metrics are entirely different… so is the product that consumers buy in regard to “air fare.”
Here’s a shocking clue that the media – and even some supposed aviation “experts” – miss completely when they wallow into the BTS website to report on numbers they don’t understand in the first place:
“Air fares” are NOT like a gallon of gas, or a head of lettuce, or the cost of a BigMac. Those things are a consistent and uniform product wherever they are sold.
Air fares, to the contrary, are representative of what folks are spending on a product that is different from community to community, and is representative of the unique business and economic business bases specific to each airport and community… they are not representative of a uniform and comparable product – and therefore not comparable airport to airport.
The media needs to get clued in on this.
True, this reality can put a pinch on those media types who pull down internet data without a scintilla of understanding of what they are, and then trumpet them like they just got a confidential email from Delphi.
To be clear … air fares at each airport are the result of a vast combination of consumer, demographic, operational and geographic factors… an “air fare” at Branson is not the same product as an “air fare” at Atlanta. The money spent on air fares buys very different things, based on the consumer base, size of the market, business and leisure base, and the specific nature of the destination/region.
Let’s do a quick comparison of 2018 4Q fare data… On the left we have Syracuse, and on the right we have Midland, Texas.
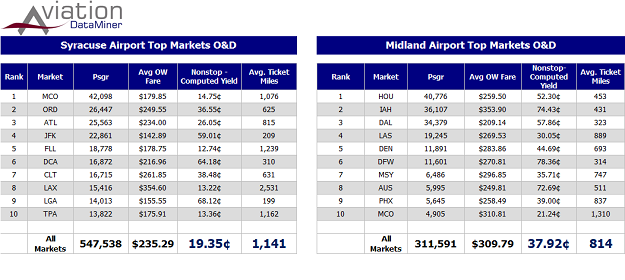
Take a look… the destinational spreads are entirely different… folks spending money on “air fare” are doing it to entirely different places. The average length of passenger trip is entirely different… The economy of SYR is generating average trips of 1,141 miles – MAF air travelers are averaging just 814 miles.
No Excuses – Not Bothering to Understand the Source Is Bad Reporting. So the type of air travel being purchased at MAF is not the same as what’s being bought at SYR. The cost per mile of flying into and out of town is different. This is because the two markets are completely different in regard to the local needs and utilization of air travel.
So these silly stories comparing air fares between communities are essentially fake news.
Not malicious fake news, but still it’s bogus information, notwithstanding. Regardless of the intent, the fact remains that the media has the responsibility to understand the source of their information before trying to fill several column inches with bad conclusions and blatant misinformation.
As another recent example, they may want to investigate the comprehensiveness – or, lack of same – in the recently-issued “Airline Quality Report.” Rather than parroting how “authoritative” it is, a glance on the specific data relied upon to rank airlines has professionals cringing.
But it makes great news. But still, fake news.
If You’re Looking for Solid Data – Aviation DataMiner Is The Choice. Raw, unfiltered information is indicative of a lot of current aviation data sources – particularly some wildly-overpriced “Quarterly” airport reports. If you’re in the market of real research data, don’t waste your money.
![]() For less than what some sources charge for providing giant printed tomes every quarter of raw BTS data for just one airport, BGI can provide on-line access to current and historical O&D, T-100, fare, and other metrics for all US airports – with customizable reports – on-line, 24/7.
For less than what some sources charge for providing giant printed tomes every quarter of raw BTS data for just one airport, BGI can provide on-line access to current and historical O&D, T-100, fare, and other metrics for all US airports – with customizable reports – on-line, 24/7.
Again, for less than getting a giant, cookie-cutter report containing static charts and graphs Aviation DataMiner delivers the ability to cross-reference and analyze airports across the nation – with data going back to year 2000.
So, click here to request a trial subscription… including a one-on-one training review with a professional at Boyd Group International.
We’ll show you a better source of planning intelligence.