The Post-Ian Florida Vulnerability –
The Impulse Capacity Bubble Just Got Punctured
For several Florida airports, hurricane Ian just accelerated entry to the New Year. The hit to air traffic demand expected in the 1Q 2023 due to a declining economy is likely already started.
The combination of inflation, recession, and now the aftermath of hurricane Ian is likely to partially or in some cases materially deflate the bubble of impulse travel capacity generated to key points in Florida in the 2020-2021 period.
Relying on data from our friends at Cirium, we accomplished a quick comparison of the capacity changes at non-hubsite airports outside of the Panhandle (read: ex-Miami) between the full year ending in September 2019 and the same period ending September 2020.
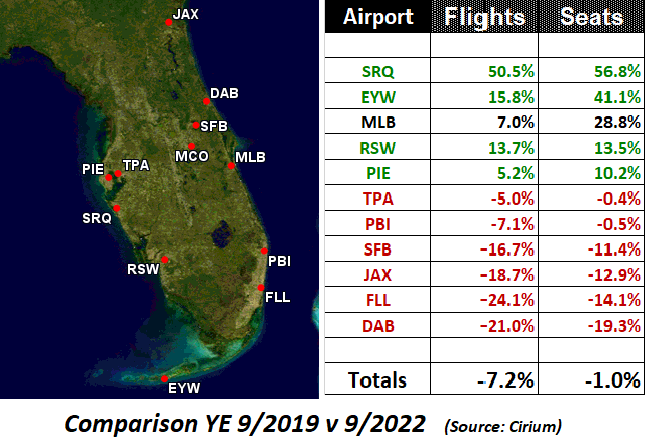 The data illuminates a clear view of the fundamental changes in the air traffic foundation in the state.
While the actual total capacity was almost the same (down only about 1% in the current period compared to pre-CCP pandemic numbers) the destinational mix changed completely.
In effect, the traffic today is far more dependent on the ULCC expansions at secondary airports than any consistent organic growth across the state.
It has been ULCC increases – aimed at impulse travel, not organic demand – that has been the story over the last two years in Florida. Indeed, it’s a geographic and airline-determined story.
In short, Florida was a refuge for ULCC airline capacity in the 2020-2022 period, which also took advantage of what was pent-up travel demand in the post CCP-Covid period. (We’d note that MLB is an outlier in that it has attracted some international service that somewhat skews its data.) The traditional Florida markets continue to experience significantly lower capacity compared to 2019.
Airline Strategies Will Be The Window To 2023. What needs to be fully understood is that it’s airline strategies that are in play. The five airports which were the recipients of massive increases in low-fare capacity were beneficiaries of internal and independent airline-specific strategies, as opposed to having been deluged with massive landfill-destined “true market studies” from the airports involved.
This means it will be airline strategic decisions regarding capacity, competitive issues and fleet changes that will be the determinants of the future enplanement levels at these airports. However, as discretionary dollars are increasingly vaporized by inflation, it is the airports in green that are most likely to experience the most severe declines in traffic demand to fill the seats added in the last 18 months.
The other airports may well be affected by the recession, but they do not have any substantial or vulnerable excess impulse air service capacity.
The Near-Term Picture. The initial effects of Hurricane Ian will be substantial traffic hits in October and November, as tourism venues and other infrastructure are restored. But this is likely only going to advance the calendar for enplanement reductions as the recession deepens in the 1Q of 2023, and federal programs increase inflation during the same period. (Regardless of nonsense doggerel coming from inside the Washington Beltway.)
The prognosis for the airports in green is likely initial Ian-driven schedule reductions that will be very slow to be restored, if at all, in the latter part of 2023.
Short-Term Recession Forecast & Airline Trend Projections. The coming year will be one of enormous shifts in airline strategies. Boyd Group International is accomplishing. recession-focused airport trend and enplanement forecasts for key clients. It will be a very different 2023 from what was expected just six months ago.
Get prepared. Hit the Contact button and send us an email to start the conversation specific to your airport.
_________________